

POS – WorkDo Dash SaaS Add-On Guide
Process retail sales, manage billing, inventory, warehouses, returns, and receipts.
Introduction
The POS Add-On is a simple and efficient system for managing all your point-of-sale operations in one place. It helps you process in-store sales, manage customers and billing counters, and handle product returns with ease. You can also set up discounts, generate product barcodes, and keep track of stock across multiple warehouses. Detailed reports give you clear insights into sales, products, and customer activity over time. Overall, it helps you run a smooth and organized retail operation while keeping accurate records for better decision-making.
How to Use The POS Add-On?
POS Dashboard
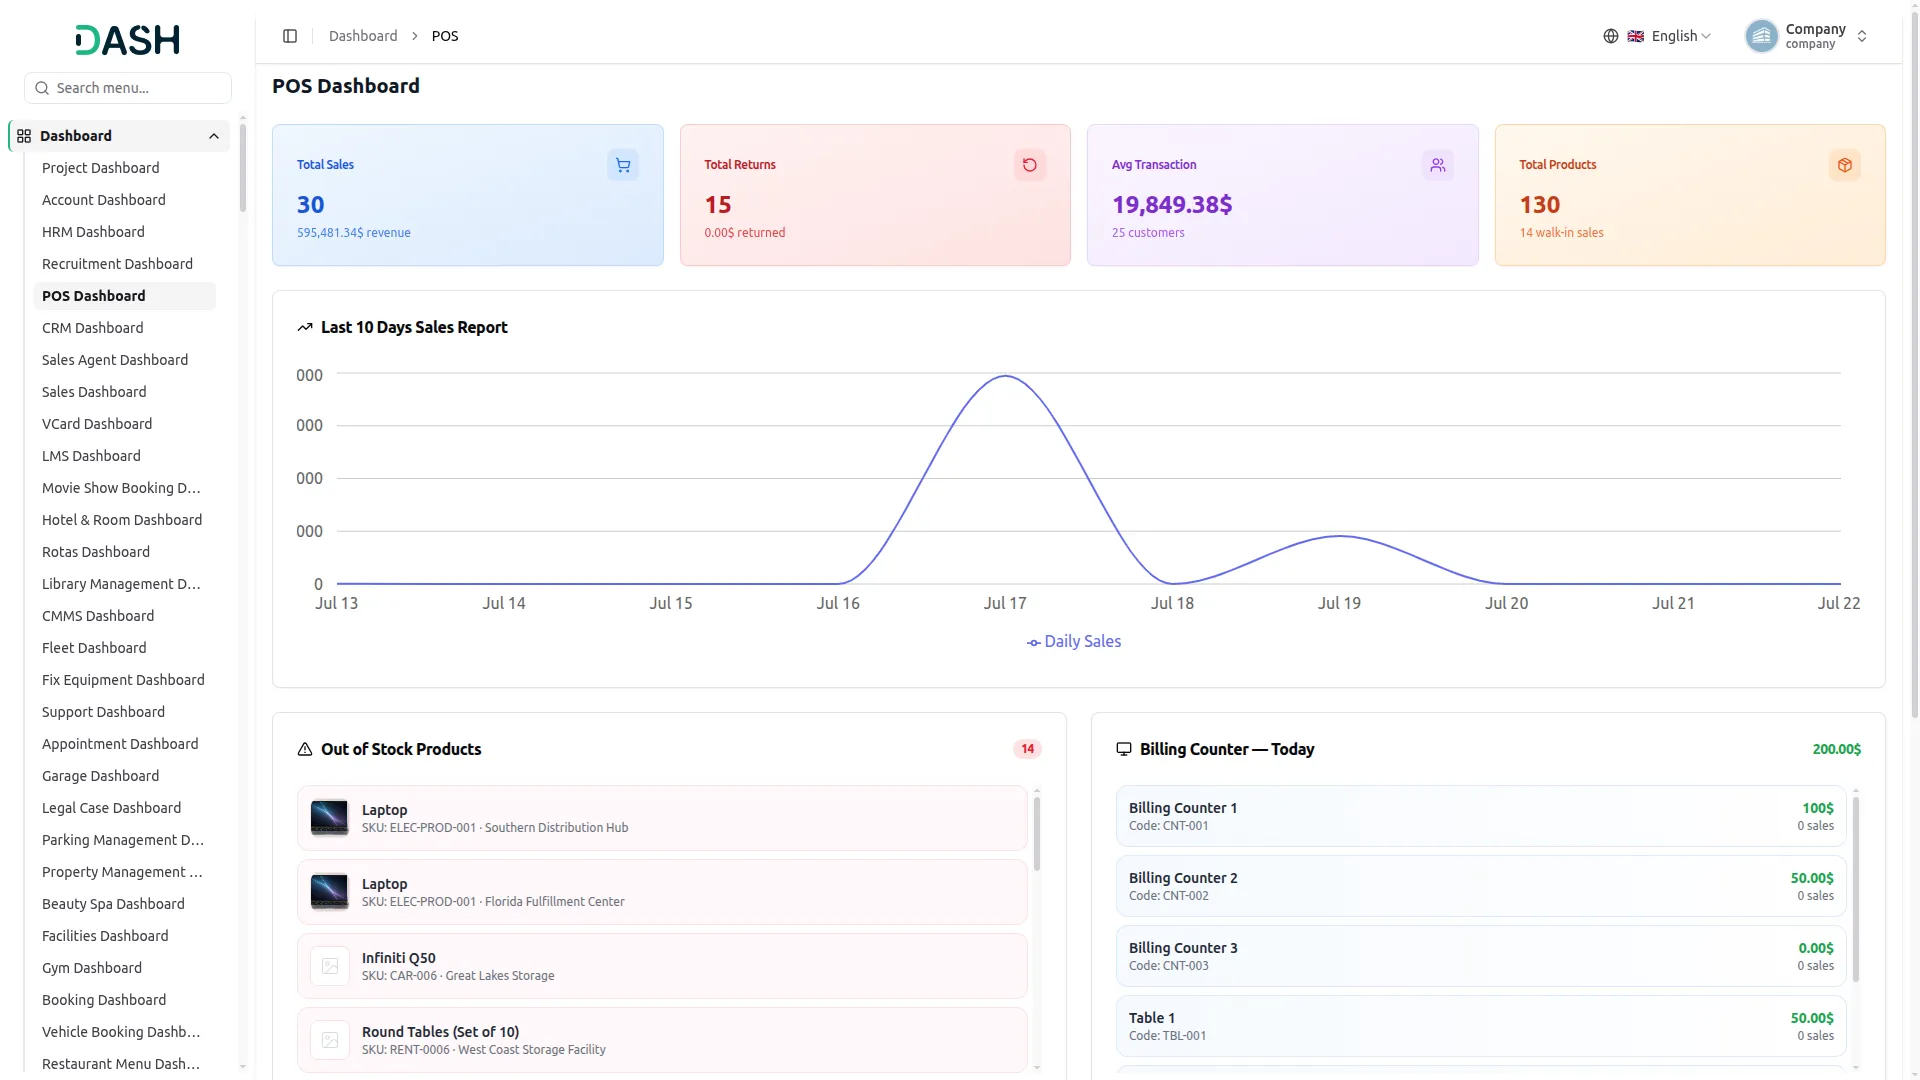
- The POS Dashboard gives a company-wide overview of your point-of-sale activity through a set of summary cards, a sales chart, and supporting panels.
- Four cards across the top summarize key metrics. Total Sales shows the number of sales along with the total revenue generated. Total Returns shows the number of returns along with the amount returned. Avg Transaction shows the average transaction value along with the number of customers. Total Products shows the number of products along with the count of walk-in sales.
- The Last 10 Days Sales Report chart plots daily sales activity across the previous ten days. Hover over any point on the line to see the exact sales figure for that day.
- The Out of Stock Products panel lists items that need restocking, each showing the product image, name, SKU, and warehouse location, with a badge in the corner indicating the total number of out-of-stock items.
- The Billing Counter, Today panel lists each billing counter with its name, Code, today’s sales total, and number of sales, while the figure at the top right shows the combined total across all counters for the day.
- The Top Selling Products panel ranks your best performers, each showing its rank, product name, total revenue, and units sold, displayed with a progress bar for easy comparison.
- The Recent Transactions panel lists the latest sales, each showing the POS Number, customer, date, and amount.
- The Recent Returns panel lists the latest returns, each showing the Return Number, customer, amount, and current status (such as draft).
Add POS
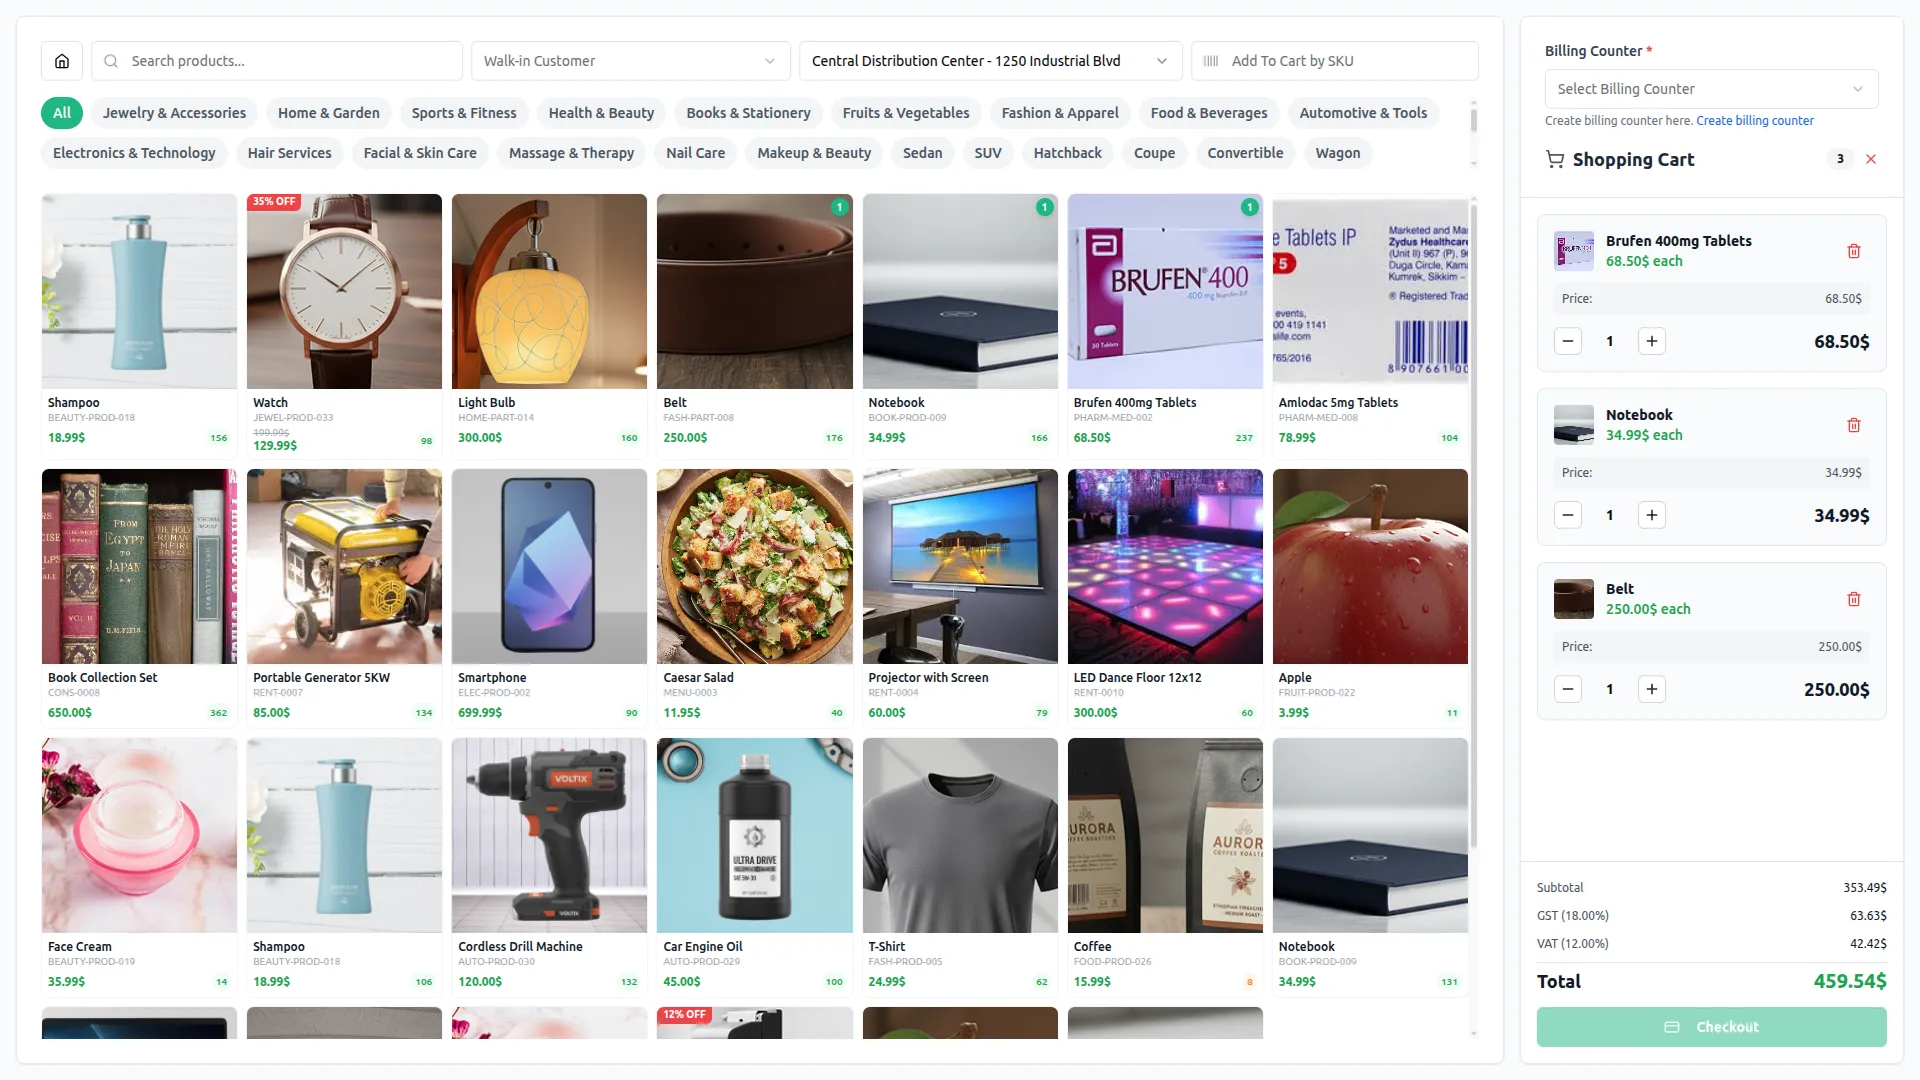
- The POS screen is your quick and easy way to process in-store sales. The product grid on the left displays all available items with their image, name, SKU, price, and stock count. Use the category tabs at the top (such as Jewelry & Accessories, Home & Garden, Sports & Fitness, Electronics & Technology, and more) to browse products by category, or use the Search products bar to find a specific item quickly.
- At the top of the screen, select the Customer from the dropdown (which is populated from the user management section) and choose the Warehouse from the location dropdown to specify where the stock will be pulled from. You can also use the Add To Cart by SKU field to add a product directly by scanning or entering its SKU.
- To add a product to the cart, simply click on any product card. It will appear in the Shopping Cart panel on the right side of the screen. Use the “+” and “−” buttons next to each item to increase or decrease the quantity, or click the delete button to remove an item from the cart entirely. The badge next to the cart title shows the current number of items, and the “✕” at the top right clears the entire cart at once.
- If a discount is applied to a product, it will be shown on the product. The discount will also be included in the final amount section. It will also appear on the thermal print.
- The Shopping Cart panel displays each item with its name, unit price (shown as “each”), quantity, and line total. At the bottom, you can see the Subtotal, GST, VAT, and the final Total amount, all calculated automatically.
- Select the Billing Counter from the dropdown at the top of the cart panel before proceeding, as this field is required (marked with an asterisk) to assign the sale to a specific counter.
- Click “Checkout” to open the Process Payment screen, and after clicking Complete Sale in POS, the system processes the payment, completes the transaction, generates a unique receipt number, applies tax and discount calculations, automatically updates stock by reducing sold items, and produces a final invoice/receipt with all details, which can be downloaded as PDF or printed via thermal print or normal print options, along with a success confirmation message.
- In POS, the stock is automatically reduced every time a product is sold from the system.
- After completing the sale, a confirmation message appears with the Receipt Number and a full itemised receipt showing product details, taxes, discount, and total, along with a “Thank you for your business!” message. Use “Download PDF” to save the receipt, “Print” to print a copy, or “Close” to dismiss the screen.
POS Orders
- The POS Orders screen lists every sale processed through the POS, so you can review past transactions at a glance. Each row displays the Sale Number, Customer, Warehouse, and Total amount. Use the Search bar at the top to find a specific order.
- Use the Filters panel to narrow the list by Customer or Warehouse fields and click Apply, or click Clear to reset the filters and view all orders again. You can toggle between list view and grid view using the buttons at the top right.
- In the Actions column, click the view button to open the full POS Sale detail view for that order.
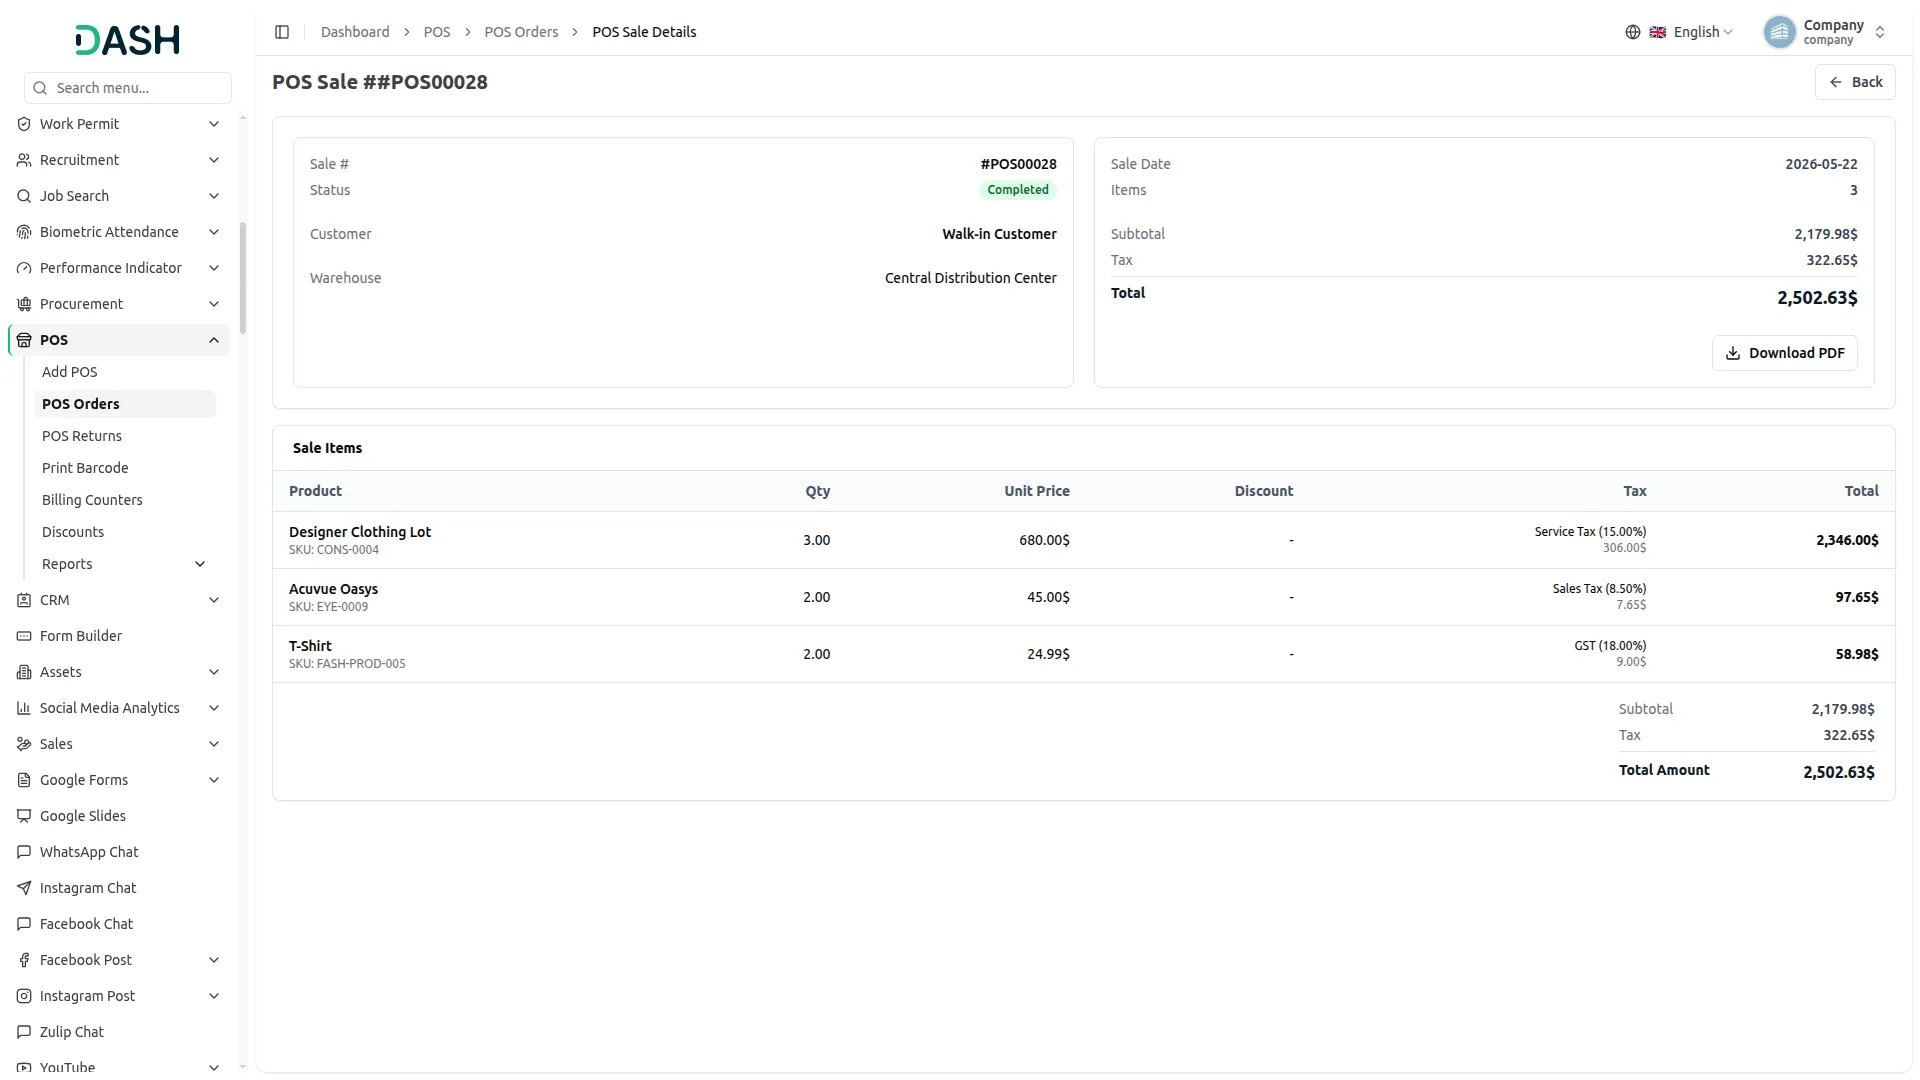
- When you click the view button, open a POS Sale with complete details of a single transaction. At the top, you’ll see the Sale Number, a status badge (such as COMPLETED), and the Total Amount of the sale.
- The header is divided into three sections: Company (your business name, address, phone, and email), Customer (the buyer’s name, or Walk-in Customer if none was selected, along with the Warehouse the stock was pulled from), and Details (the Sale Date and the number of Items in the order). Use the “Download PDF” button in the Details section to save a copy of the sale.
- The Sale Items table lists every product in the order with its Product name and SKU, Qty, Unit Price, Subtotal, Discount, Tax (shown as a labelled badge such as Sales Tax (8.50%) or GST (18.00%)), Tax Amount, and line Total.
- At the bottom of the table, the Subtotal, Tax, and final Total Amount are calculated automatically, giving you a full breakdown of the completed sale.
Manage POS Returns
- To add a new POS return, click the “Create” button on top of the POS Return page. Enter the Return Date, select the Original POS Order from the dropdown (fetched from the POS Order section), and optionally choose a Warehouse from the dropdown (fetched from the Purchase module).
- Next, select a Return Reason from the dropdown options: Defective, Wrong Item, Damaged, Excess Quantity, or Other. Use the Notes field to add any additional context.
- The Manage POS Returns list every return processed through the POS, so you can track and manage them in one place. Each row displays the Return Number, Customer, Warehouse, Return Date, Total Amount, Items (with quantities displayed), and the current Status. Use the Search bar at the top to find a specific return by its return number.
- When a customer returns an item, the system updates the stock and increases it accordingly.
- Use the Filters panel to narrow the list by Customer, Warehouse, Status, or Date Range, set your criteria, and click Apply, or click Clear to reset and view all returns again. You can toggle between list view and grid view using the button.
- In the Actions column, use the Approve Return button to approve a return order, the View button to see the POS return details, or the Delete button to remove it.
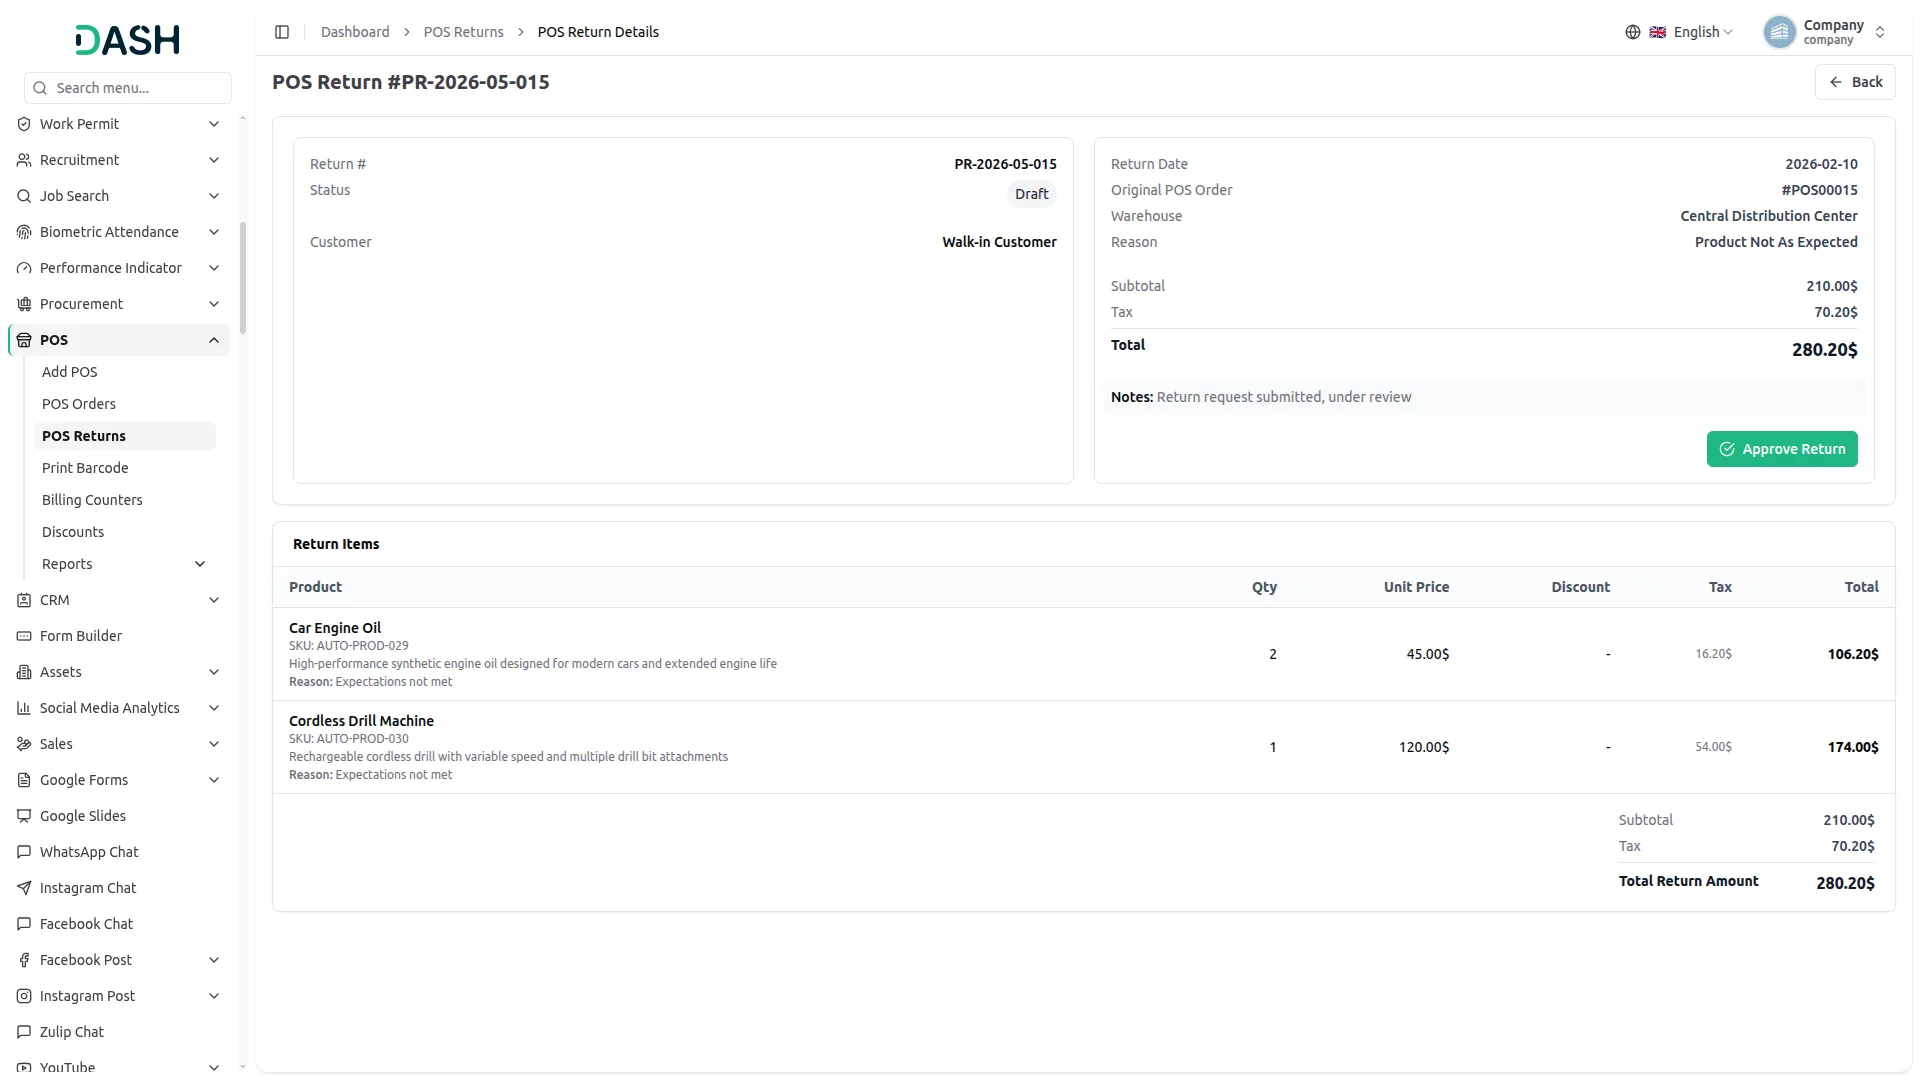
- When you click the view button, it opens a POS Return page that shows the complete details of a single return. At the top, you’ll see the Return Number, a status badge (such as DRAFT), and the Total Amount.
- The header is divided into sections: Customer (name, email, and Billing Address), Shipping Address, and Details (the Return Date, the linked Original POS Order, the Warehouse, and the Reason for the return). Any free-text Notes entered when creating the return appear just below.
- The Approve Return button sits in the Details section alongside the Return Amount. Click it to approve the return and move it out of Draft status.
- The Return Items table lists each returned product with its Product name, SKU, description, item-level Reason, Qty, Unit Price, Discount, Tax, and line Total. At the bottom, the Subtotal, Tax, and final Total Return Amount are calculated automatically.
Product Barcode
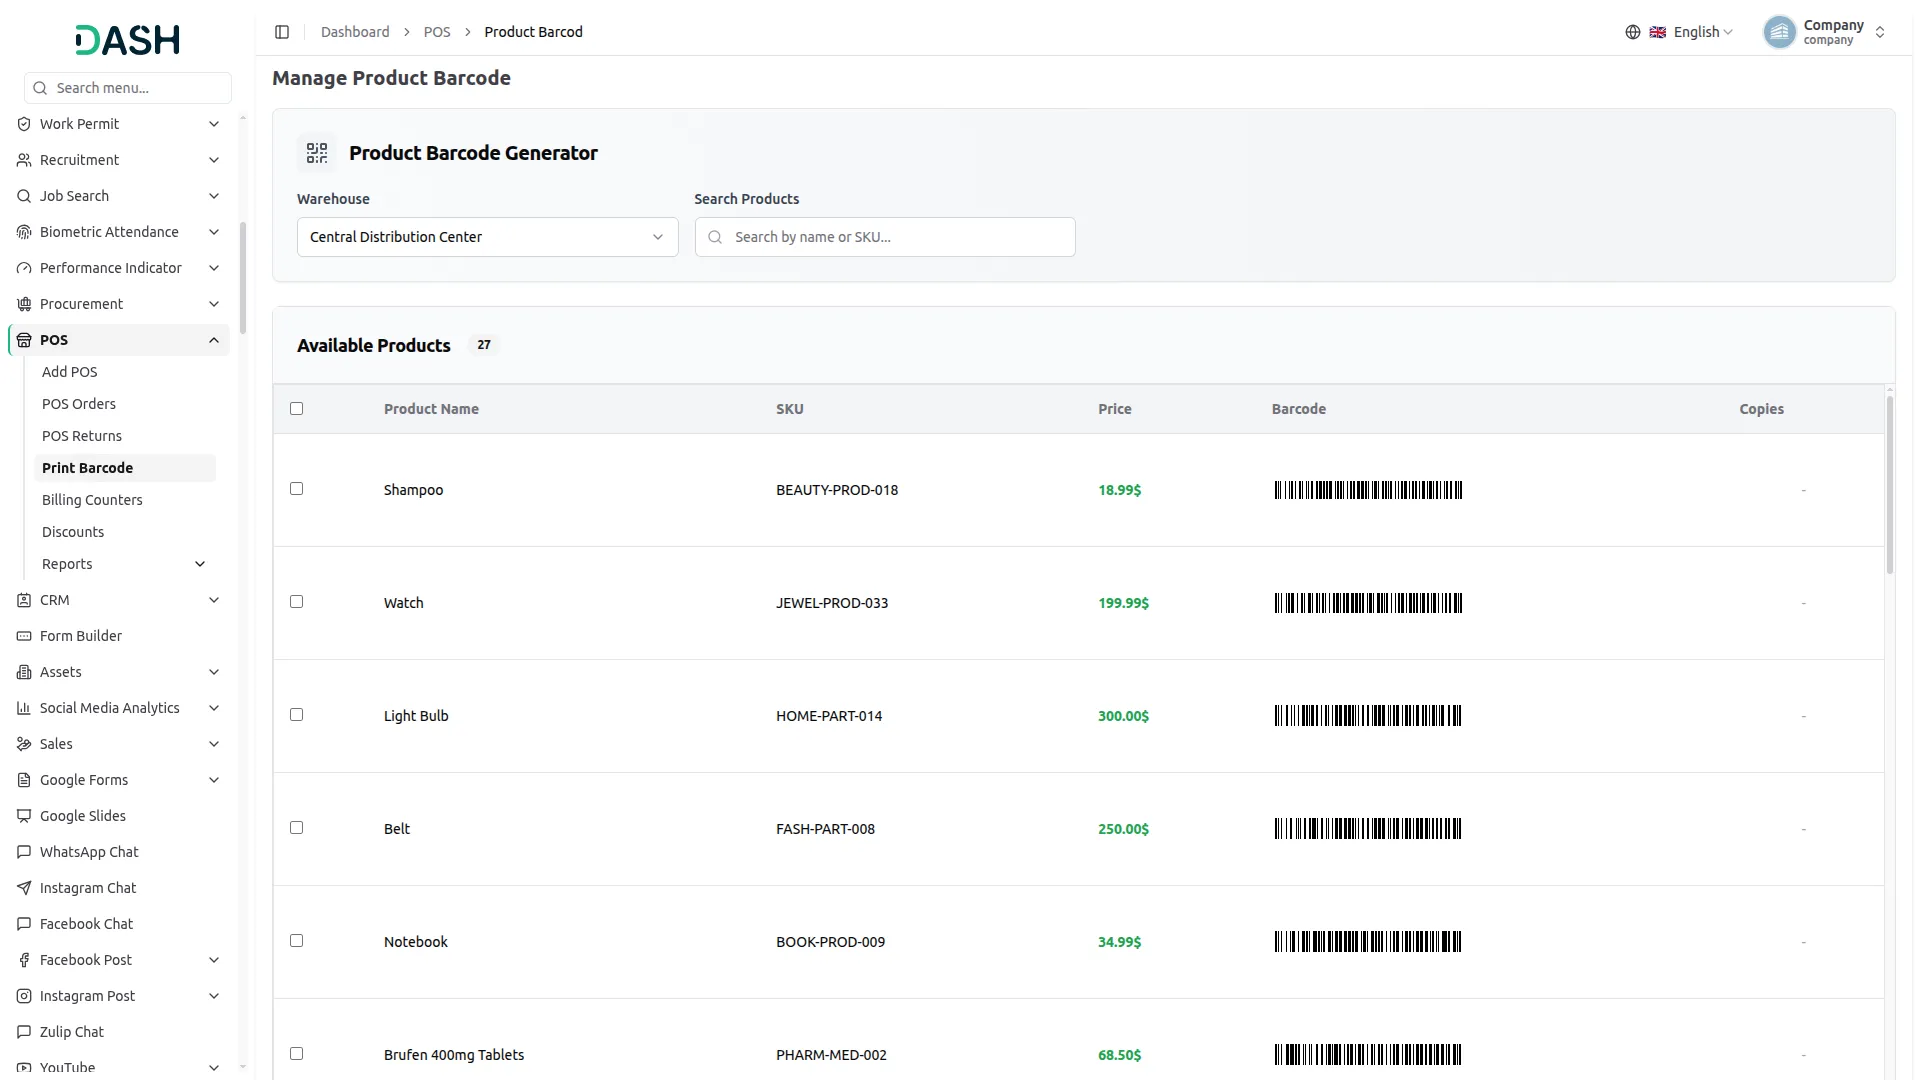
- The Manage Product Barcode page displays the Product Barcode Generator, where you select a Warehouse from the dropdown to filter products by location and use the Search Products field to find a specific product by name or SKU.
- The Available Products section lists all products in the selected warehouse, along with a total count, showing details such as Product Name, SKU, Price, Barcode, and Copies.
- Barcodes are generated using SKU, which comes from the product and service module. You can download these barcodes in bulk based on quantity and also generate barcode exports according to warehouse product data.
POS Billing Counters
- To create a new POS Billing Counter, click the “Create” button, which will open the Create POS Billing Counter form. In this form, you need to enter the Counter Name and a unique Counter Code, and select the Bank Account from the dropdown. You can also add an optional Description. Toggle “Status” ON to mark the counter as Active.
- You can set up multiple billing counters in POS billing orders, and they will be displayed in the Add POS section.
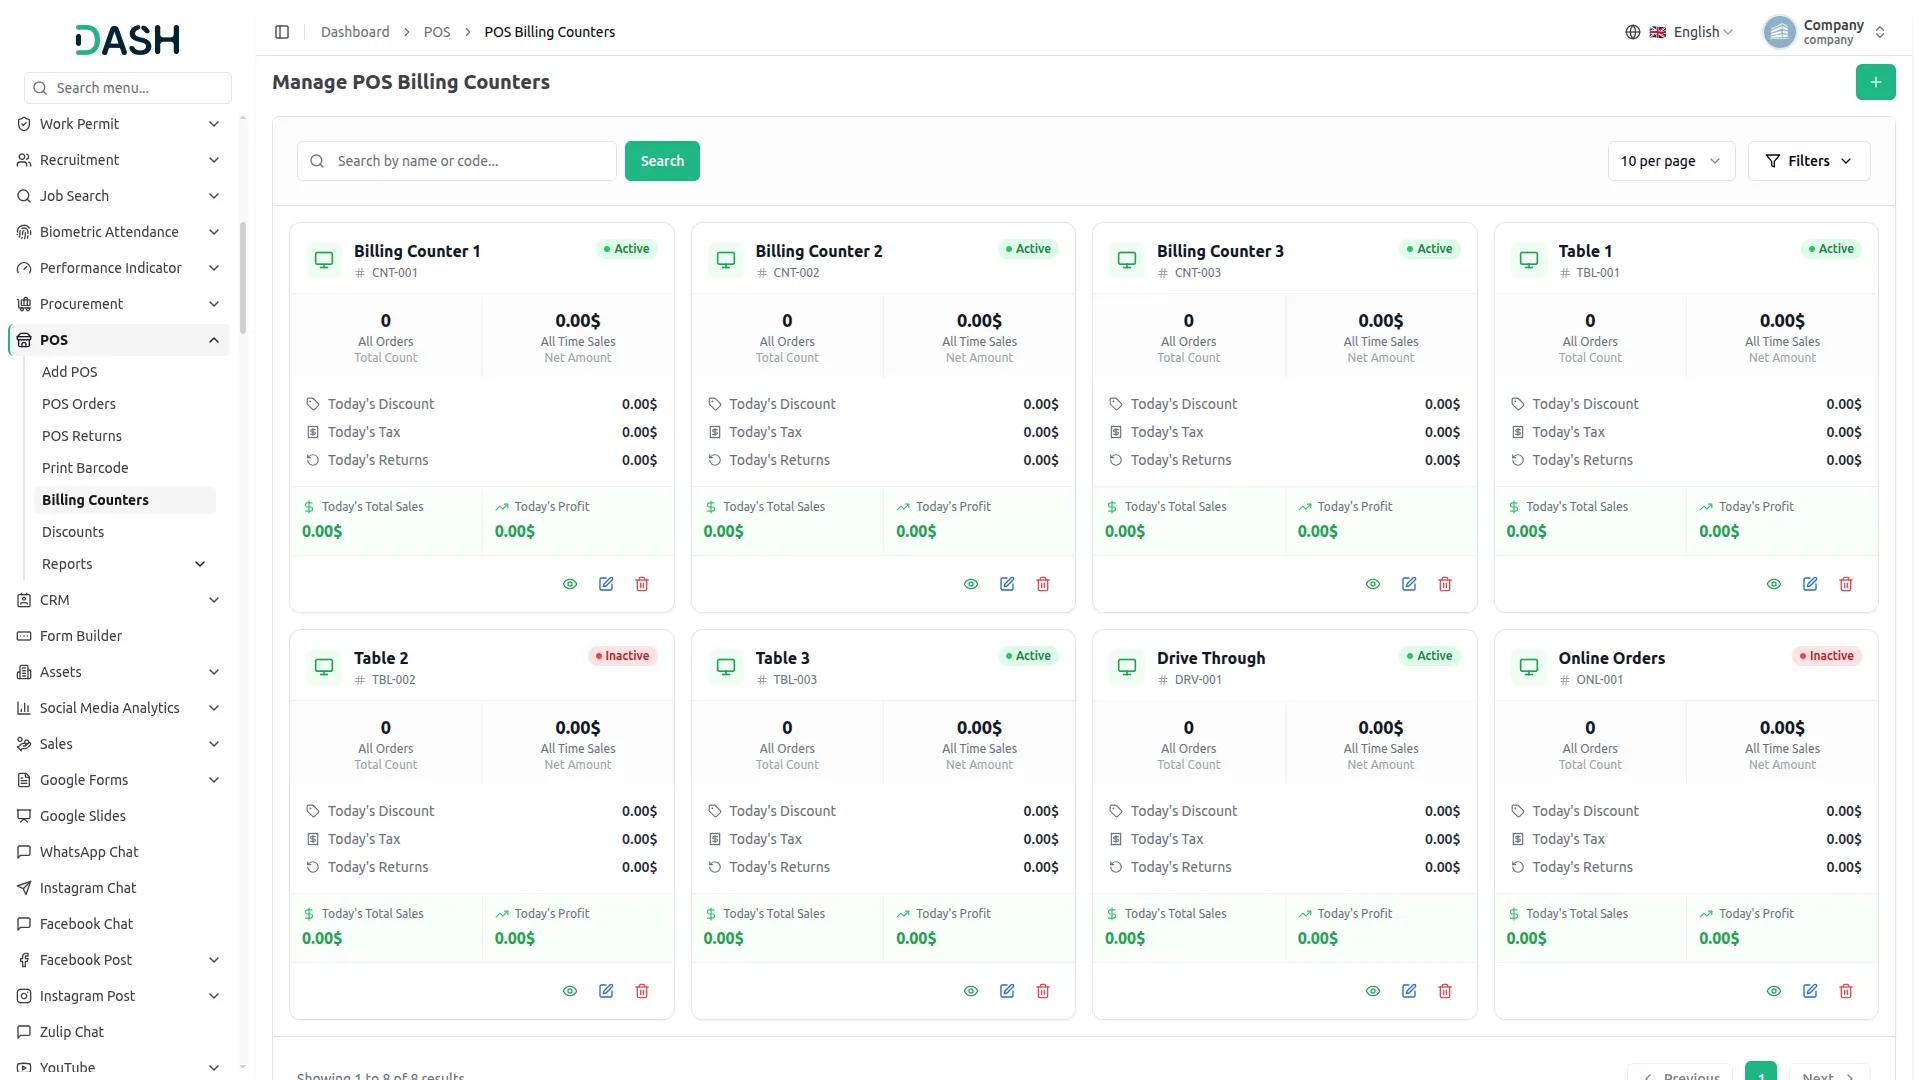
- The Manage POS Billing Counters list page displays all billing counters configured for the POS system. Each record shows the Counter Name, Counter Code, and Status (Active or Inactive). Use the search bar to find specific counter data, and apply filters by Status using the dropdown, then click “Apply” to filter or “Clear” to reset.
- In the action column, use the view option to see the counter details, the edit option to modify the details, or the delete option to remove the counter.
POS Discounts
- To add a new discount, click the “Create” button at the top of the POS discount page. Under Discount Details, enter the discount Name and select what the discount applies to using the Apply On dropdown — Category or Product.
- If “Category” is selected, choose the relevant Category from the dropdown that appears
- If “Product” is selected, the Category field is replaced by a Select Products section below the form. This section displays the total count of available products, along with a “Select All” checkbox at the top right. Use the Filter by Category dropdown and the Search Products field to narrow down the list by name or SKU. Each record shows a checkbox, Product Name, SKU, and Price. Check the box next to each product you want to apply the discount to.
- Next, select the Discount Type (Percentage, Fixed), and enter the Discount (%) value and the Minimum Quantity required for the discount to apply. Select the Start Date and End Date to define the discount’s validity period.
- Note: The discount will be available only until the selected end date. After that date, it will not be visible.
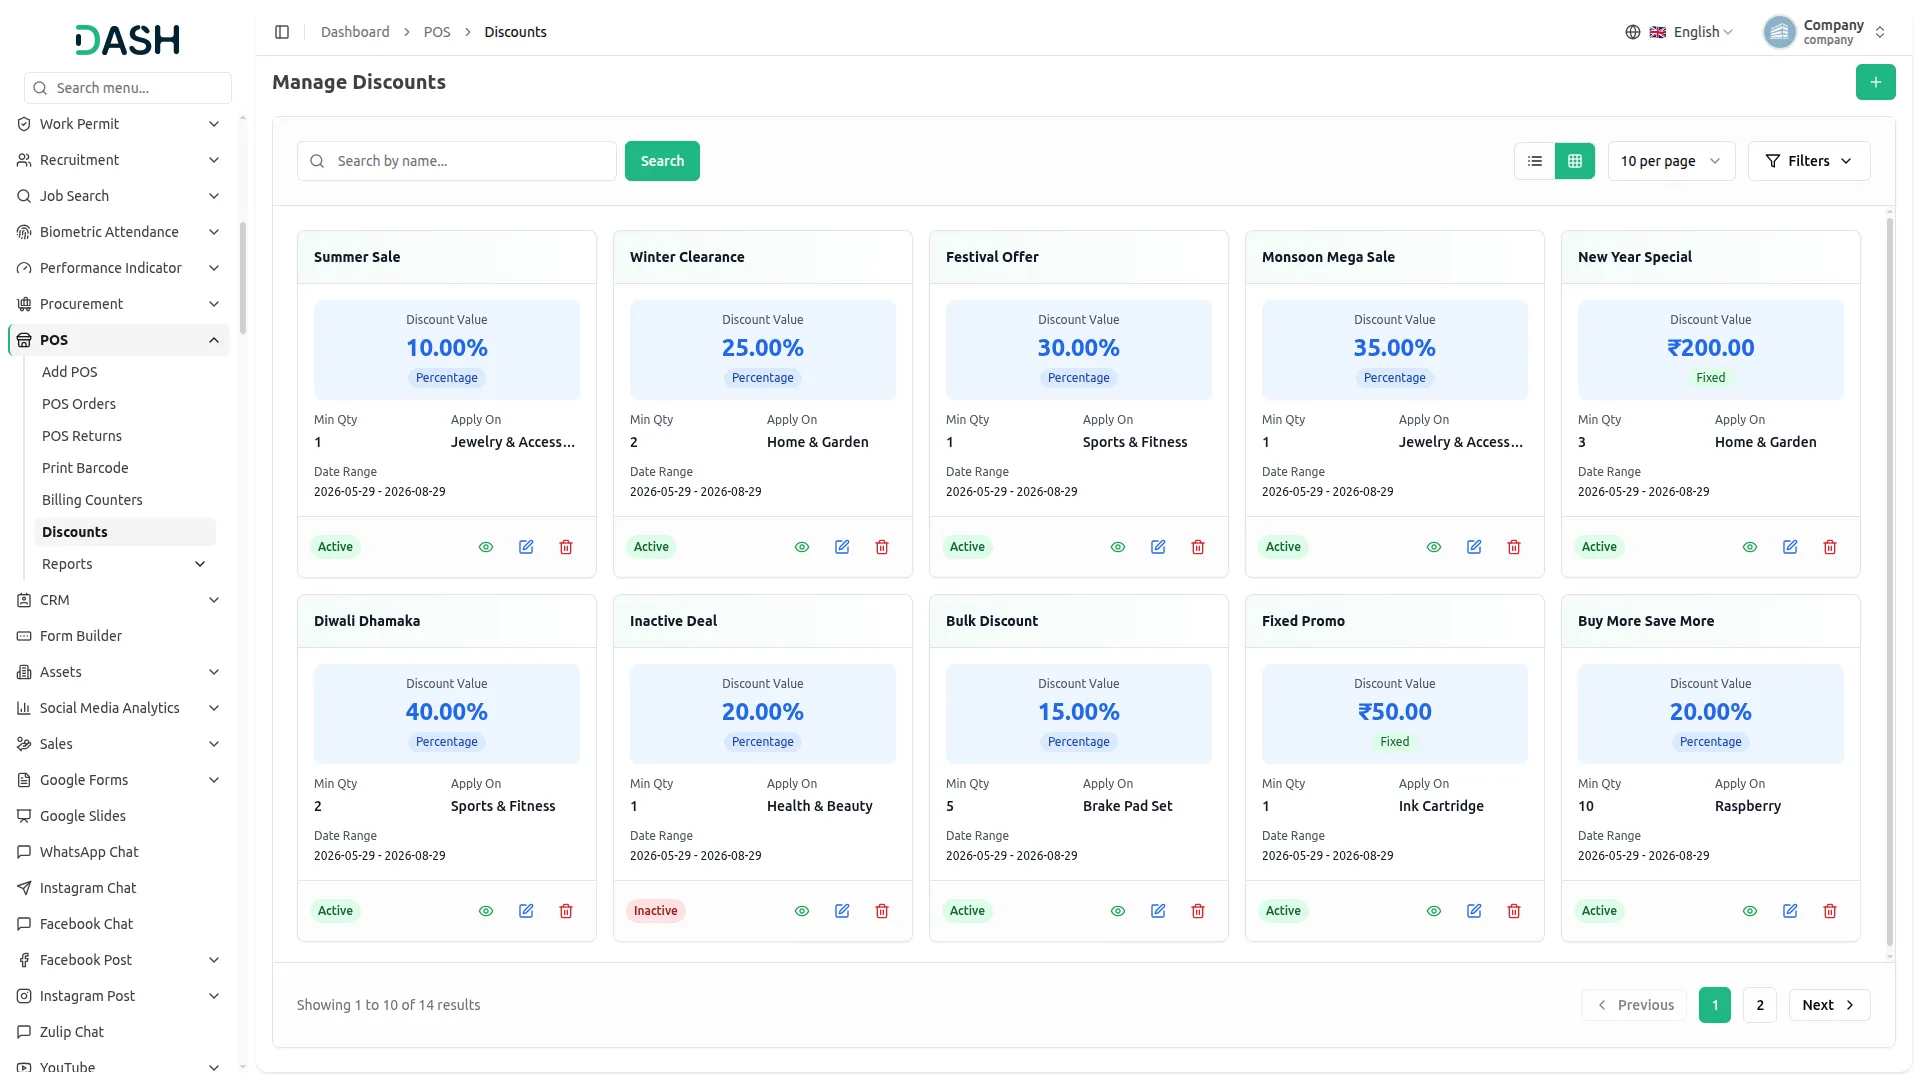
- The Manage POS Discounts list page displays all discount setups for the POS in a column. Each row shows the Name, Type, Value, the Apply On category, Min Qty required to trigger the discount, the active Date Range, and the current Status (Active, Inactive). Use the Search bar at the top to find a specific discount by name.
- Use the Filters panel to narrow the list by Discount Type, Status, or Date Range, set your criteria and click Apply, or click Clear to reset and view all discounts again. You can toggle between list view and grid view using the button.
- In the Actions column, use the view to see a full discount, the edit to update it, or the delete to remove it.
Reports
Sales Report
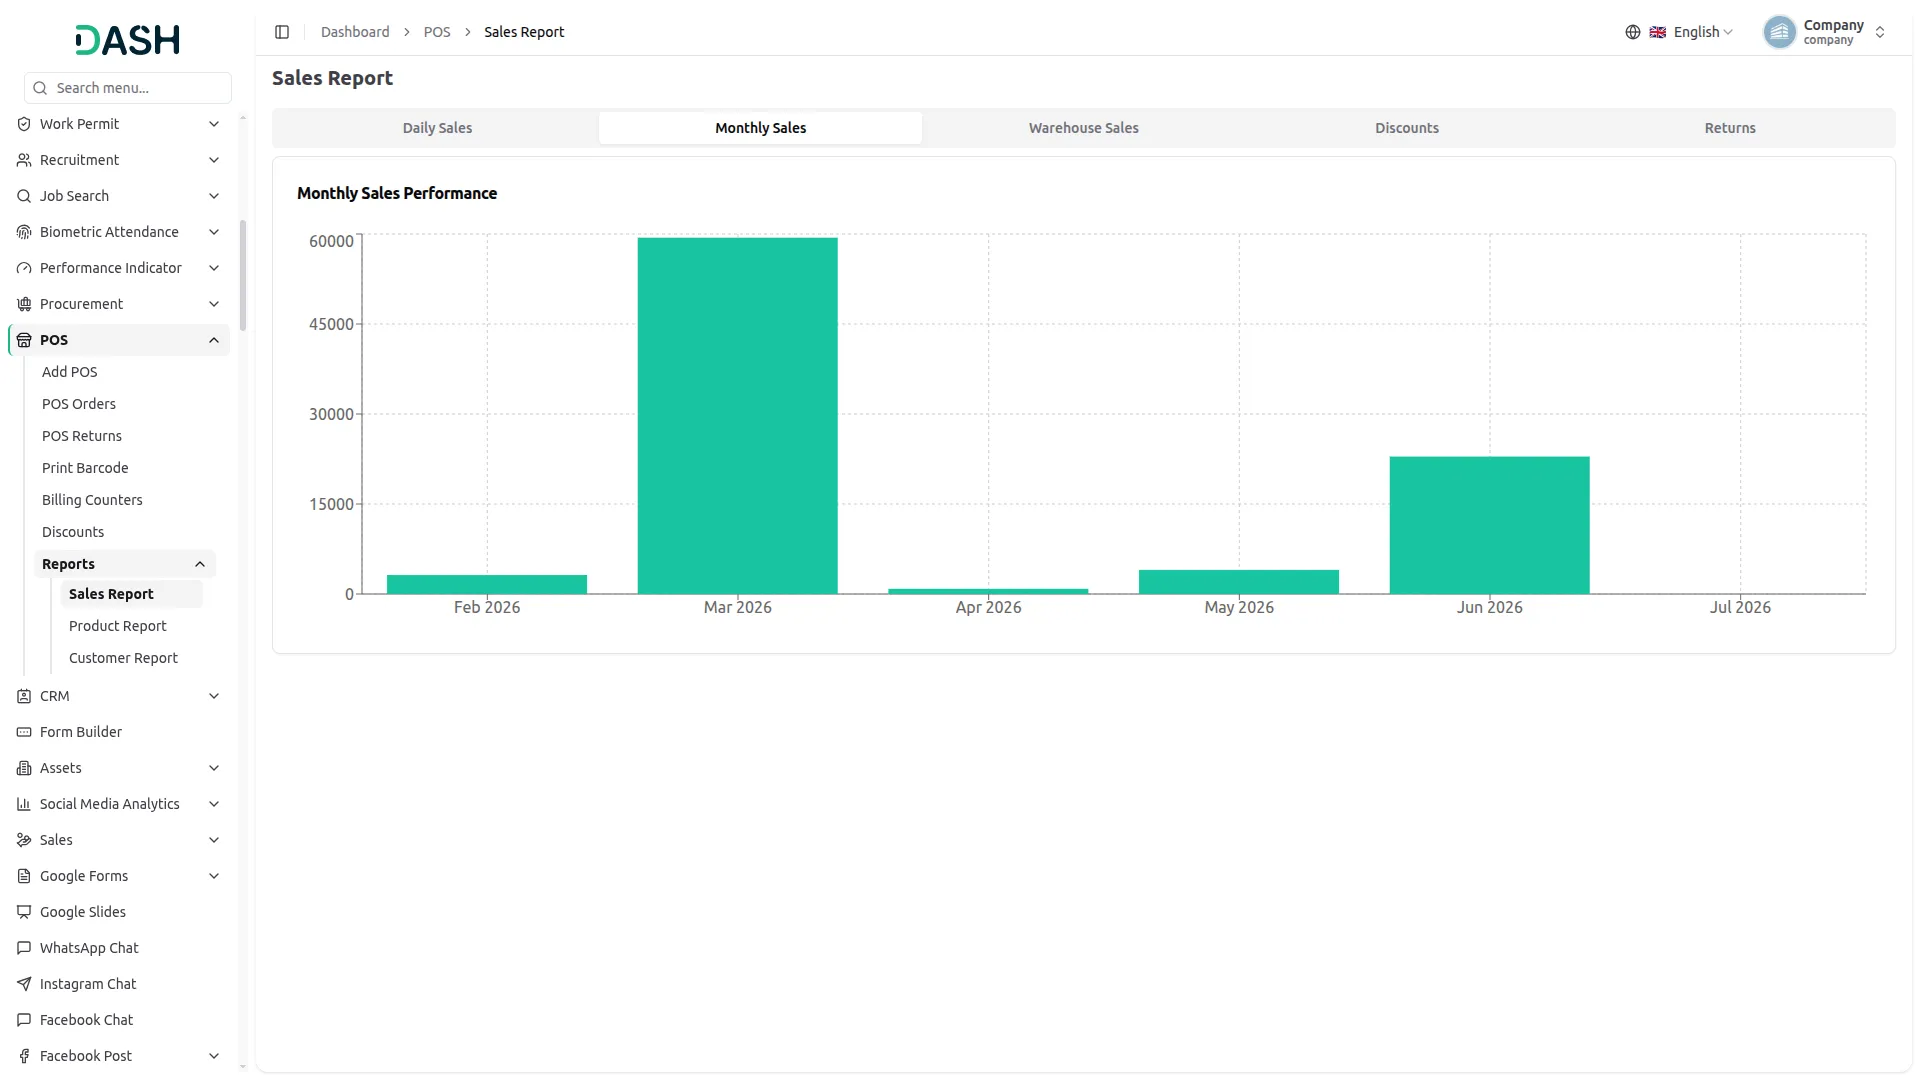
- The Sales Report screen gives you a visual overview of your POS performance across several views. Use the tabs at the top (Daily Sales, Monthly Sales, Warehouse Sales, Discounts, and Returns) to switch between the different reports.
- The Daily Sales tab shows the Daily Sales Performance chart, a line graph plotting sales activity day by day across the selected period so you can spot short-term trends and quiet days at a glance.
- The Monthly Sales tab shows the Monthly Sales Performance chart, a bar graph comparing total sales for each month, making it easy to see which months performed strongest over the year.
- The Warehouse Sales tab shows the Warehouse Sales Comparison chart, a bar graph comparing total sales across each warehouse (such as Central Distribution Center, Texas Distribution Point, and Northern California Facility) so you can see which locations are driving the most revenue.
- The Discounts tab opens with three summary cards (Total Discount Given, Revenue with Discounts, and Products with Discounts) followed by the Monthly Discount Trends line chart (hover over any point to see the discount amount for that month) and a Top Products by Discount Given table listing each product’s Product Name, SKU, Discount Given, and Revenue Generated.
- The Returns tab opens with three summary cards: Total Returns, Return Amount, and Products Returned, followed by the Monthly Return Trends line chart and a Top Returned Products table listing each product’s Product Name, SKU, Return Count, and Return Amount, so you can quickly identify which items are being returned most often.
Product Report
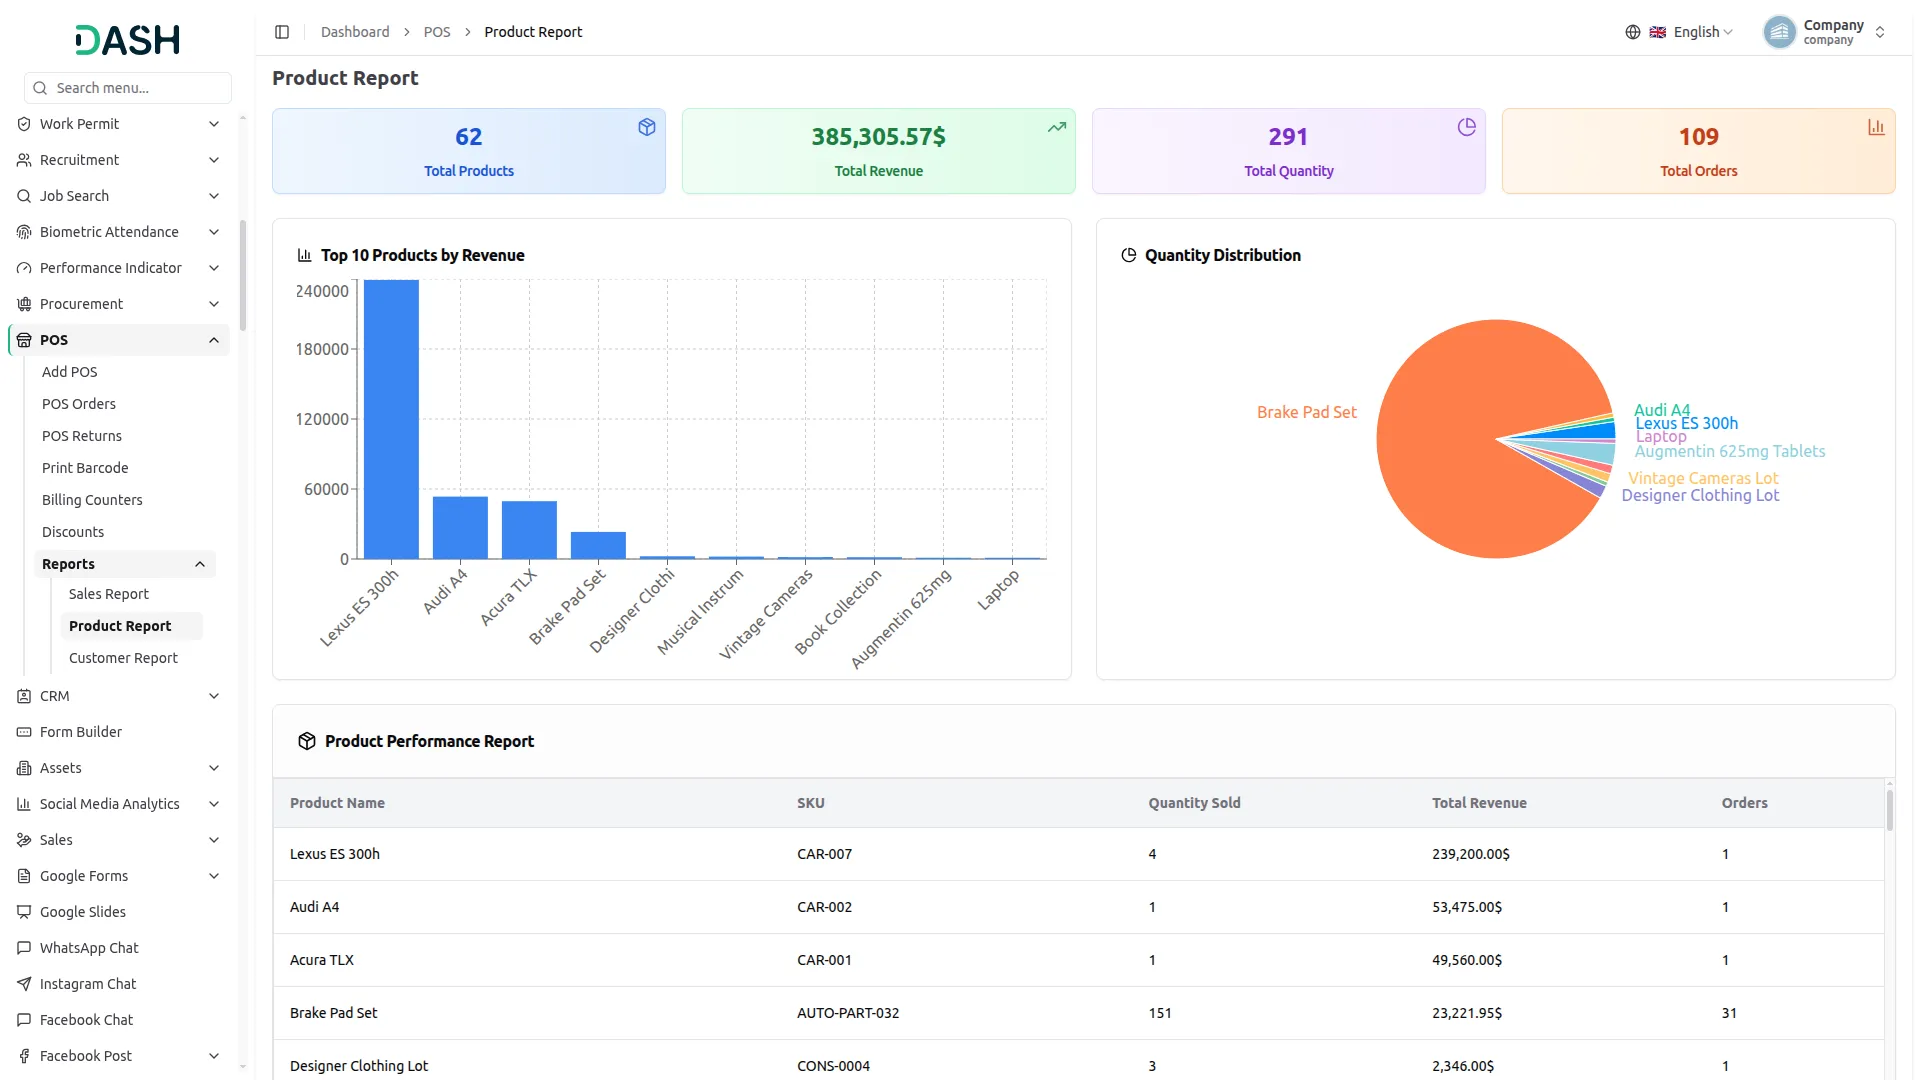
- The Product Report screen gives you a visual breakdown of how your products are performing. At the top, four summary cards show the key figures at a glance: Total Products, Total Revenue, Total Quantity, and Total Orders.
- The Top 10 Products by Revenue chart is a bar graph ranking your highest-earning products (such as Lexus ES 300h, Audi A4, and Acura TLX) so you can quickly see which items are driving the most revenue.
- The Quantity Distribution chart is a pie graph showing each product’s share of the total quantity sold, with a colour-coded label for every product, making it easy to see how sales volume is spread across your catalogue.
- The Product Performance Report table lists each product in detail with its Product Name, SKU, Quantity Sold, Total Revenue, and number of Orders, giving you a full row-by-row view of product performance.
Customer Report
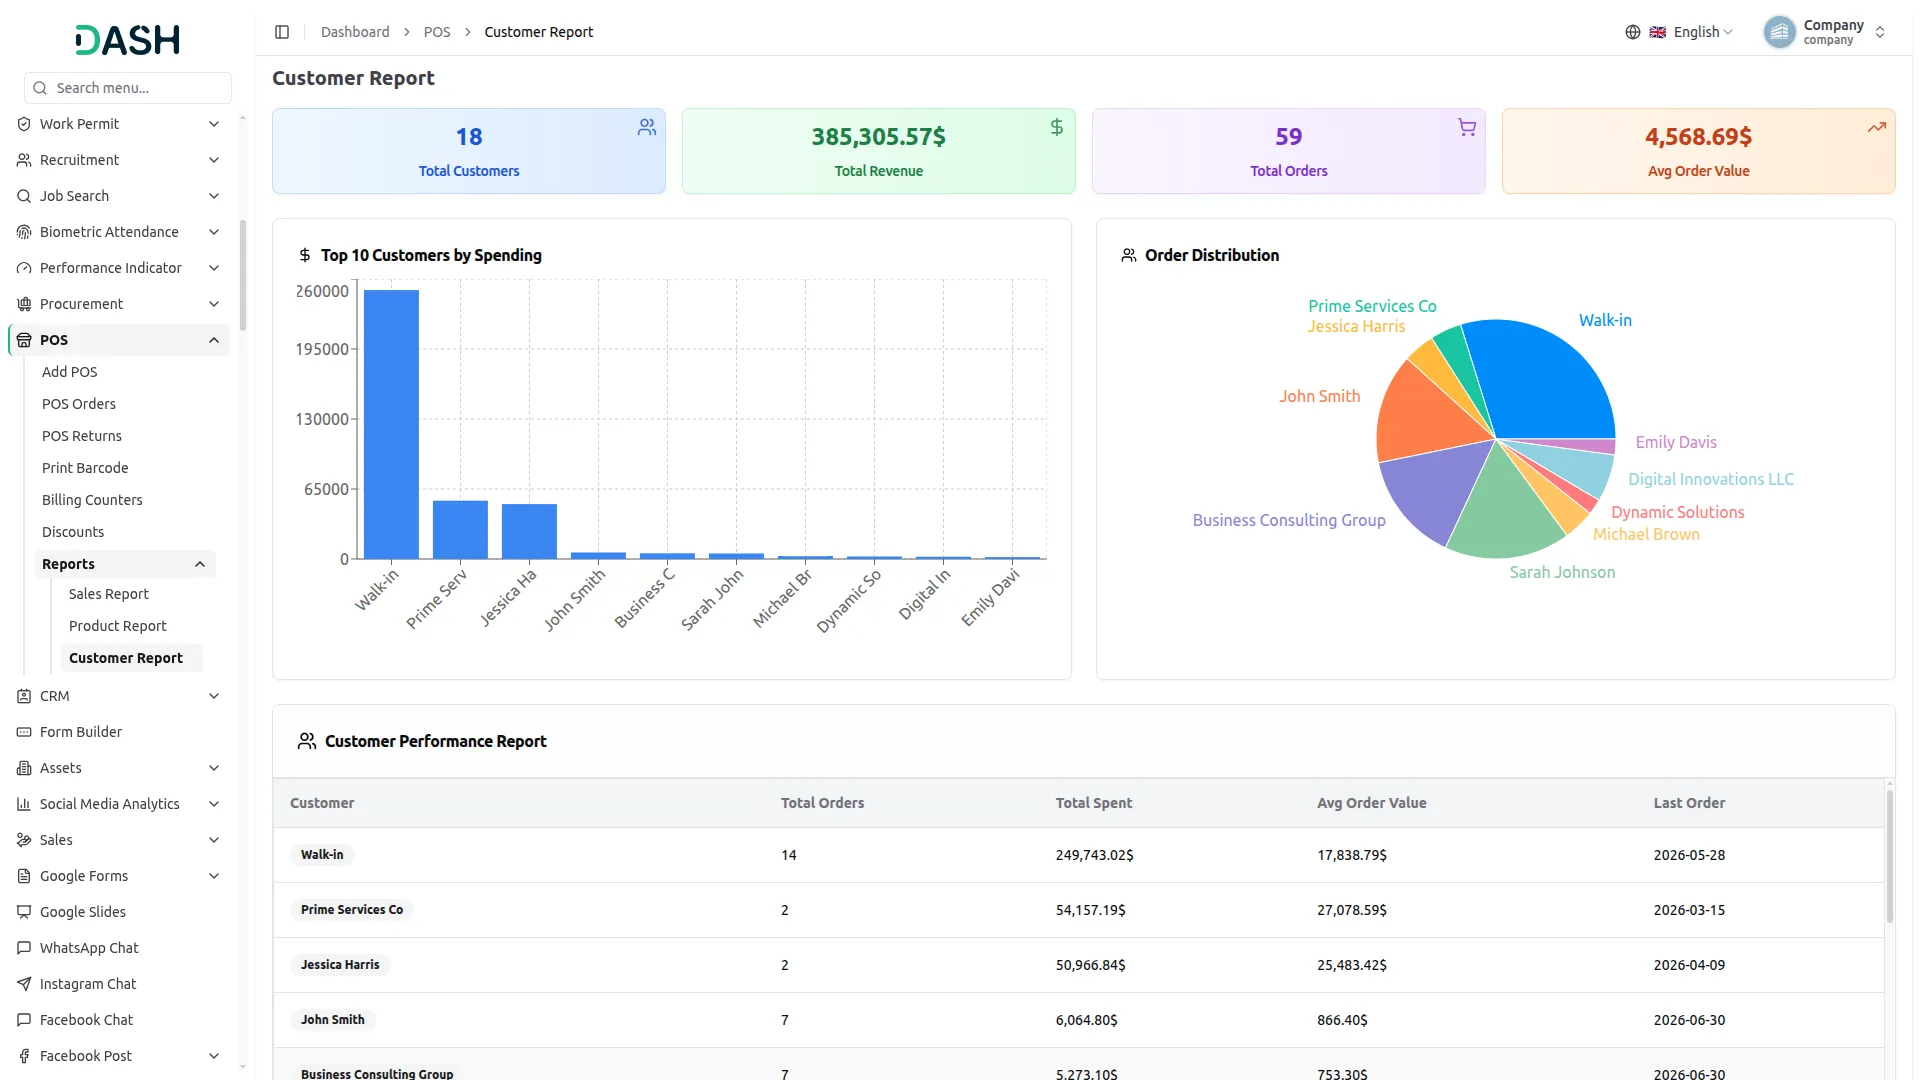
- The Customer Report screen gives you a visual breakdown of your customers and their buying behaviour. At the top, four summary cards show the key figures at a glance: Total Customers, Total Revenue, Total Orders, and Avg Order Value.
- The Top 10 Customers by Spending chart is a bar graph ranking your highest-spending customers (such as Walk-in, Prime Services Co, and Jessica Harris) so you can quickly see who is contributing the most revenue.
- The Order Distribution chart is a pie graph showing each customer’s share of total orders, with a colour-coded label for every customer, making it easy to see how your order volume is spread across your customer base.
- The Customer Performance Report table lists each customer in detail with their Customer name, Total Orders, Total Spent, Avg Order Value, and the date of their Last Order, giving you a full row-by-row view of customer activity.
Categories
Related articles
- Webhook – WorkDo Dash SaaS Add-On Guide
- SinchSMS – WorkDo Dash SaaS Add-On Guide
- GoTo Credentials Generation Guide
- Bundle Products – eCommerceGo SaaS Add-On Guide
- MSG91 – WorkDo Dash SaaS Add-On Guide
- WhatsApp API – TicketGo Add-On Guide
- Mailchimp – BookingGo SaaS Add-On Guide
- Project Template – WorkDo Dash SaaS Add-On Guide
- MyFatoorah – BookingGo SaaS Add-On Guide
- PayU – BookingGo SaaS Add-On Guide
- Mark as Important – TicketGo Add-On Guide
- Backup & Restore – BookingGo SaaS Add-On Guide
We're Here to Help - Let's Talk
Have questions about our solutions, customization services, or business tools? Our team is here to help you. let's talk.